Structure analysis
Several structure analysis and manipulation tools are implemented
in MAISE package which can be used in the command-line with the
corresponding task-specifier flag. Working primarily with the VASP
structure format (POSCAR file) as input, MAISE can
determine the space group using SPGLIB [1]
measure the similarity of two structures via RDF pattern comparison
calculate volume per atom for bulk and cluster geometries [4]
align the cluster in the simulation box along the high symmetry axes, etc.
By default, the code expects a POSCAR file in the running
directory for operations involving a single structure or two
POSCAR0 and POSCAR1 files for structure
comparison. Alternatively, one can specify an input file name,
e.g. CONTCAR, as
$ maise 1 CONTCAR -FLAG
or two input file names, e.g. POSCAR and CONTCAR as
$ maise 2 POSCAR CONTCAR -FLAG
The structure examination and manipulation functions are run by calling MAISE with a FLAG:
$ maise -FLAG
FLAG |
Short Description |
|---|---|
compute the RDF for POSCAR |
|
compute dot product for POSCAR0 and POSCAR1 using RDF |
|
compare RDF, space group, and volume of POSCAR0, POSCAR1, POSCAR2, etc. |
|
convert POSCAR into str.cif, CONV, PRIM |
|
convert str.cif into CONV |
|
rotate a cluster along eigenvectors of moments of inertia |
|
move all atoms along a specified direction by a shift |
|
order species in POSCAR by Z or manually |
|
find whether POSCAR is periodic (3) or non-periodic (0) |
|
reset the box size for clusters |
|
make a supercell using 3 or 9 input integers |
|
compute volume per atom for crystals or clusters |
|
run customizable user code in user.c |
Space group solver (with SPGLIB)
spg
Uses the Space Group Library (SPGLIB) to symmetrize an input structure
POSCAR to the closest space group found. An optional tolerance
value can be specified as $ maise -spg [TOL] to test for
space group at a specific tolerance (the default is 0.01 A). If a
negative tolerance value is specified, MAISE outputs the symmetry at
all orders of magnitude in increments of one (e.g., \(N \times
10^{M}\)) up to the specified tolerance. It prints the space group
number along with the Pearson symbol on the screen and generates
crystallographic information file
str.cifconventional unit cell
CONVprimitive unit cell
PRIM
In case the structure has too many nearest neighbors (above the default value of 500) within the 6-A cutoff, the maximum number can be increased with a second optional argument [NMAX].
Command Use
$ maise -spg [TOL] [NMAX]
Example 1
$ maise -spg
             139    tI2      I4/mmm   1.0E-02    1.0000
In the output of the $ maise -spg command, the first is the space group number, the second is the Pearson symbol, the third is the International symbol, the fourth is the tolerance used, and the fifth is the RDF dot product between the original and symmetrized conventional structure.
Example 2
$ maise –spg 0.01
        139    tI2      I4/mmm   1.0E-02    1.0000
$ maise –spg 0.0005
        12     mS2      C2/m     5.0E-04    1.0000
$ maise –spg -0.1
        229    cI2      Im-3m    1.0E-01    0.6891
        139    tI2      I4/mmm   3.0E-02    1.0000
        12     mS2      C2/m     1.0E-03    1.0000
cif
Converts an input crystallographic information file str.cif into
the conventional unit cell CONV. If a primitive unit cell
PRIM is needed, one should copy CONV into POSCAR and rerun
MAISE with the spg FLAG.
Note that the formats of .cif files produced by different packages
vary and might not yet be readable by MAISE. In working with VESTA,
for example, it is recommended to save the structure as POSCAR in
the VASP format and then find the space group using MAISE with the
spg FLAG.
Structure comparison
dim
Determines the periodicity of the structure in POSCAR. Returns 3
if the structure is periodic or 0 if the structure is non-periodic,
i.e., a cluster. It does this by finding the neareast neighbor
distances between atoms in different image cells. If no such distances
below the default value of 6 A are found the structure is considered
non-periodic. Note that the operation will not determine the
dimensionality correctly of a cluster if lattice vector shifts are
needed to bring all atoms into one contiguous shape. The cutoff
distance can be adjusted with an optional [RCUT] argument.
Command Use
$ maise -dim [RCUT]
vol
Computes the volume in \(A^{3}/atom\) for the structure in POSCAR.
rdf
Computes the radial distribution function (RDF) for a given POSCAR
input structure. The RDF is computed by finding the bondlength
distribution for all atoms and applying a small Gaussian spreading the
the distribution to smooth out the peaks. Relevant parameters for the
calculation are the max number of nearest neighbors, the soft/hard
cutoff for finding neighbors, and the Gaussian spread value. The
output files produced are the nearest neighbor list list.dat and
bond.dat, the original RDF rdf.dat, and the normalized RDF
RDF.dat
The following equation describes the RDF calculation for a structure of arbitrary composition, where \(s_i\) and \(s_j\) denote the atomic species of atoms \(s_1\) and \(s_2\). The \(R_n\) distinguishes which bin of the histogram is being evaluated, where \(R_n=n/N_{\mathrm{bin}}R_{\mathrm{hard}}\) (\(N_{\mathrm{bin}}=3,000\)). The cutoff \(f_{\mathrm{cut}}(R_n)=1\) when \(R_n<R_{\mathrm{soft}}\) and \(f_{\mathrm{cut}}(R_n)=\cos\left(\pi/2\frac{R_n-R_{\mathrm{soft}}}{R_{\mathrm{hard}}-R_{\mathrm{soft}}}\right)\) when \(R_{\mathrm{soft}}<R_n<R_{\mathrm{hard}}\).
\(\mathrm{RDF}_{s1,s2}(R_n)=\sum_{i,si=s1}^{N_{\mathrm{atom}}}\sum_{j\neq i,sj=s2}^{N_{\mathrm{atom}}}e^{-\frac{(R_{ij}-R_n)^2}{2\sigma^2}} f_{\mathrm{cut}}(R_n) \nonumber\)
The RDF is heavily influenced by the choice of cutoff and Gaussian smearing. It is recommended to use at least two shells of nearest neighbors (\(R_{\mathrm{hard}}\gtrsim 5 A\)) and use sharp Gaussian smearing (\(\sigma\approx0.008 A\)) for disordered structures and wide smearing for high symmetry structures (\(\sigma\approx0.02 A\)).
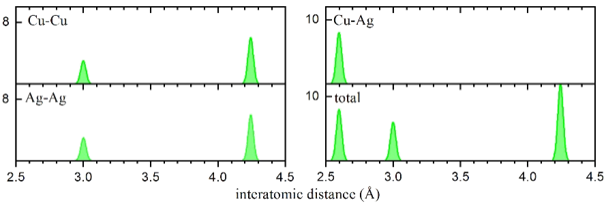
Total and decomposed RDF for a CuAg phase. The decomposed RDF graphs show the bond lengths between the various species.
Command Use
$ maise -rdf [NMAX] [RSFT] [RHRD] [SPRD]
Example 3
$ maise -rdf
Max number of nearest neighbors      500
Soft cutoff for finding neighbors    5.700000
Hard cutoff for finding neighbors    6.000000
Gaussian spread for smearing bonds   0.008000

Neighbor   list      written to     list.dat
Bond       list      written to     bond.dat
Normalized RDF       written to     RDF.dat
Original   RDF       written to     rdf.dat
cxc
Compares two input structures POSCAR0 and POSCAR1 by finding the RDF dot product between them.
In particular, the RDF of each structure is multipled together to produce a value between [0..1] which designates the similarity of the two structures.
The similarity value is sensitive to the choice of Gaussian smearing used in the RDF, as low smearing will result in appearent low similarity between structures with slightly different bond length distributions.
The output files list#.dat and RDF#.dat contain the nearest neighbor list and RDF of POSCAR0 and POSCAR1.
The following equations describe the calculation of CxC dot product between two structures \(k = 1,2\).
\(C_1\cdot C_2 = \sum_n^{N_{\mathrm{bin}}}\sum_{s1}^{N_{\mathrm{spc}}}\sum_{s2}^{N_{\mathrm{spc}}} \mathrm{RDF}_{1,s1,s2}(R_n)\mathrm{RDF}_{2,s1,s2}(R_n)/(\mathrm{norm}_1\mathrm{norm}_2) \nonumber\)
\(\mathrm{norm}_k = \left[ \sum_n^{N_{\mathrm{bin}}}\sum_{s1}^{N_{\mathrm{spc}}}\sum_{s2}^{N_{\mathrm{spc}}} \mathrm{RDF}_{1,s1,s2}(R_n)\mathrm{RDF}_{2,s1,s2}(R_n) \right]^{1/2} \nonumber\)
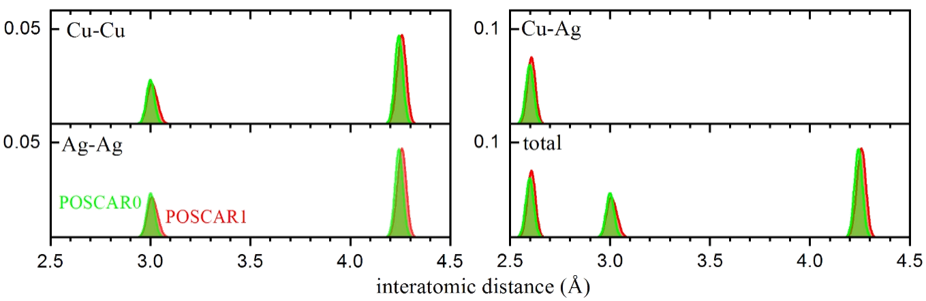
Total and decomposed RDF for a CuAg phase. The amount of overlap between the bond distributions determines the similarity of the structures.
cmp
Compares input structures POSCAR0 and POSCAR1 by their cxc
RDF dot product, space group at various tolerances, and cell
volume. As the following example demonstrates, it is possible for a
structure to have a different symmetry group between the various
tolerences that MAISE tests at.
Example 4
$ maise -cmp
 STR     vol/atom           space group number           RDF scalar product
number   A^3/atom     10^-1   10^-2   10^-4   10^-8         0          1

  0     12.153926       12      15      15      15      1.000000   0.573549
  1     11.895450       15      15      15      15      0.573549   1.000000
Structure manipulations
rot
Rotates the cluster in POSCAR along the eigenvectors of its moments of inertia, which is
then stored in CONTCAR.
The cluster is aligned depending on the following criteria
If all eigenvalues are degenerate the structure is rotated such that the furthest atoms from the center are placed along the x- and z-axes
If first two eigenvalues are degenerate the structure is rotated such that the furthest atom from the center in the x-y plane is placed along the x-axis
If last two eigenvalues are degenerate the structure is rotated such that the furthest atom from the center in the y-z plane is placed along the z-axis
If all the eigenvalues are unique the structure is aligned along the eigenvectors.
mov
Moves all atoms in POSCAR along a specified direction by a fractional shift and stores the structure in CONTCAR.
Example 5
$ maise -mov 1 0.25
ord
Orders species in POSCAR by element number Z or according to a specified list and stores the structure in CONTCAR.
Example 6
To reorder Li B C into B C Li, you should run
$ maise -ord 2 0 1
box
Resizes the box size (diagonal elements of the lattice vectors) in POSCAR and generates
a CONTCAR with the new box size. It requires one argument: the length of the new box.
Example 7
$ maise -box 20
sup
Given 3 integers, creates a \(N_{a} \times N_{b} \times N_{c}\) supercell from the unit cell in POSCAR which
is then stored in CONTCAR.
Example 8
$ maise -sup 2 3 1
Given 9 integers, creates a supercell from the unit cell in POSCAR with new lattice vectors
\(a'=n_{1}a+n_{2}b+n_3{c}\), \(b'=n_{4}a+n_{5}b+n_6{c}\), and \(c'=n_{7}a+n_{8}b+n_9{c}\), which is then stored
in CONTCAR.
Example 9
To create an orthorhombic represenation of a hexagonal cell:
$ maise -sup 1 0 0 1 2 0 0 0 1
Example 10
To create a \(\sqrt{3} \times \sqrt{3}\) expansion of a hexagonal cell:
$ maise -sup 2 1 0 -1 1 0 0 0 1
usr
Runs the piece of C-code in src/user.c. Users can customize it,
e.g., for analysis of bond or angle distributions, by modifying the
file in the installation directory and recompiling MAISE. A basic
example with variable and function description is shown below.
#include "user.h"

//==================================================================
// Examples of cell analysis operations executed with 'maise -usr'
//
//             Explanation of cell variables for Cu3Ag1
//
// C->NSPC        2               number of species
// C->N           4               total number of atoms
//
//     spc        0   1
// C->SPCZ[spc]  29  47           Z of species spc
// C->SPCN[spc]   3   1           number of atoms by species
//
//      i         0   1   2   3
// C->ATMN[i]     0   0   0   1   species types for each atom
// C->ATMZ[i]    29  29  29  47   species Z     for each atom
// C->Nn[i]      78  78  78  78   number of neighbors within C->Rc (6 Ang)
//
//==================================================================
void USER_CELL(Cell *C, Cell *D, int argc, char **argv)
{
  int    i,NM;
  double A;

  C->A = C->N = 1000;                // set max number of atoms
  NM   = 300;                        // set max number of neighbors
  INIT_CELL(C,"",1,NM,0);            // allocate arrays for C->N and C->NM
  if(READ_CELL(C,"POSCAR")==0)       // read VASP-format structure
  {
    perror("POSCAR");
    exit(0);
  }

  LIST(C,1);                         // find nearest neighbors
  PRNT_LIST(C);                      // print the nearest neighbor list into list.dat
  SAVE_CELL(C,"CONTCAR",0);          // save VASP-format structure

  printf("  i   Ni   Rij_min    Ang_ijk\n");
  for(i=0;i<C->N;i++)
  {
    printf("%3d  %3d ",i,C->Nn[i]);  // print the number of neighbors within C->Rc for atom i
    printf("%9.5lf  ",C->NDX[i][0]); // print the nearest neighbor distance for atom i
    A = acos(Cos(C,i,0,1))*180.0/Pi; // find the angle between bonds to two nearest neighbors
    printf("% 9.5lf\n",A);           // print the angle
  }
}
//==================================================================